Nagios Core Tutorial: Learn Monitoring from Scratch (2026)
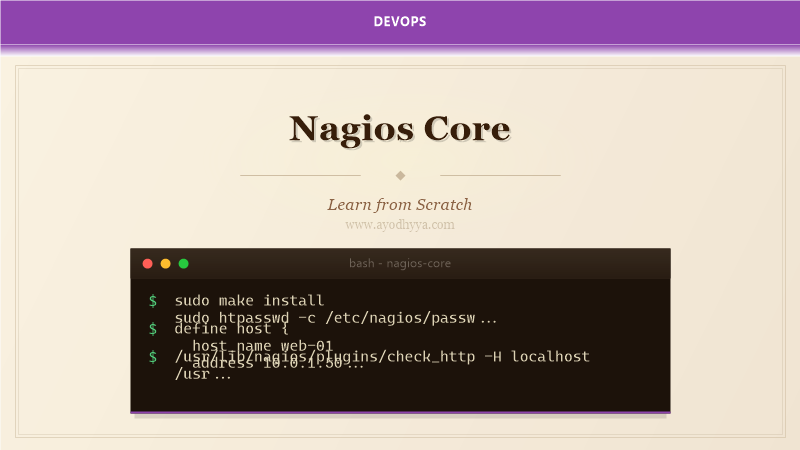
Nagios Core was my first monitoring tool and it taught me the fundamentals of infrastructure monitoring. It checks hosts and services, sends alerts when things break, and provides a web interface for status overview. While newer tools have emerged, Nagios remains widely deployed.
By the end of this tutorial, you will know how to install and configure Nagios Core, write custom plugins, set up NRPE for remote monitoring, and design alert escalations that notify the right people.
Installing Nagios Core from Source
Nagios Core installs from source on Linux. The process involves creating a nagios user, compiling the core, installing the web interface, and configuring Apache or Nginx as the web server. The Nagios Plugins package adds standard checks for common services.
sudo useradd nagios
sudo ./configure --with-httpd-conf=/etc/apache2/sites-available
sudo make all
sudo make install
sudo make install-commandmode
sudo make install-webconf
sudo htpasswd -c /etc/nagios/passwd nagiosadmin
Configuring Hosts, Services, and Contacts
Nagios configuration defines objects: hosts (servers), services (checks on hosts), contacts (who gets alerts), and time periods (when to check). Configuration files are in /etc/nagios/objects/. I use configuration includes to organize by environment.
define host {
  use           linux-server
  host_name     web-01
  alias         Web Server 1
  address       10.0.1.50
}
define service {
  use           generic-service
  host_name     web-01
  service_description HTTP
  check_command check_http
  contact_groups admins
}
Nagios Plugins and Custom Checks
Nagios Plugins provides standard checks: check_ping, check_http, check_ssh, check_disk, check_load, check_procs. Custom plugins can be any executable that returns exit codes: 0 (OK), 1 (WARNING), 2 (CRITICAL), 3 (UNKNOWN). I write custom plugins in Bash or Python.
#!/bin/bash
# check_app_health.sh
curl -s http://localhost:8080/health | grep -q "OK"
if [ $? -eq 0 ]; then
  echo "OK - App is healthy"
  exit 0
else
  echo "CRITICAL - App health check failed"
  exit 2
fi
Remote Monitoring with NRPE
NRPE (Nagios Remote Plugin Executor) runs checks on remote hosts and returns results to the Nagios server. The NRPE agent on the remote host runs checks locally. I use NRPE for checking local resources like disk usage, process counts, and log files.
define command {
  command_name check_nrpe
  command_line $USER1$/check_nrpe -H $HOSTADDRESS$ -c $ARG1$
}
define service {
  host_name     db-01
  service_description Current Load
  check_command check_nrpe!check_load
}
Alert Escalations and Notification Settings
Nagios escalates alerts through contacts and contact groups. First notification goes to the primary team. If unresolved, it escalates to the senior team. Notification intervals control how often alerts repeat. I configure different notification methods for different severities.
define contact {
  contact_name     oncall
  email            oncall@example.com
  pager            555-0100@vtext.com
}
define contactgroup {
  contactgroup_name admins
  members          oncall,manager
}
Nagios XI vs Core and Modern Alternatives
Nagios XI provides a web-based configuration interface, dashboards, and reporting on top of Nagios Core. Core requires manual config file editing. Modern alternatives include Naemon (Nagios-compatible fork), Icinga 2, and Checkmk. Many organizations still run Nagios Core for legacy environments.
# Nagios configuration files:
# /etc/nagios/nagios.cfg - Main config
# /etc/nagios/objects/ - Host/service definitions
# /etc/nagios/commands.cfg - Command definitions
sudo systemctl restart nagios
sudo tail -f /var/log/nagios/nagios.log
Frequently Asked Questions
What is the difference between Nagios Core and Nagios XI?
Nagios Core is the open-source engine with manual file-based configuration. Nagios XI is a commercial product with web UI, configuration wizards, dashboards, and reporting. XI uses Core as its monitoring engine.
How does Nagios compare to Prometheus?
Nagios uses a push model with periodic checks via SSH or NRPE. Prometheus uses a pull model scraping HTTP endpoints. Prometheus has a multi-dimensional data model and PromQL. Nagios is simpler for basic up/down monitoring.
Can Nagios monitor cloud resources?
Yes, through custom plugins and API calls. Community plugins exist for AWS CloudWatch, Azure Monitor, and GCP. The check_http plugin can query cloud service health endpoints.
What is NRPE and why is it needed?
NRPE runs Nagios plugins on remote hosts and returns results. It is needed because Nagios requires local system access for checks like disk usage, process counts, and log files that cannot be checked externally.
Originally published on Ayodhyyya. Last updated June 1, 2026.