Prometheus Tutorial: Learn Monitoring from Scratch (2026)
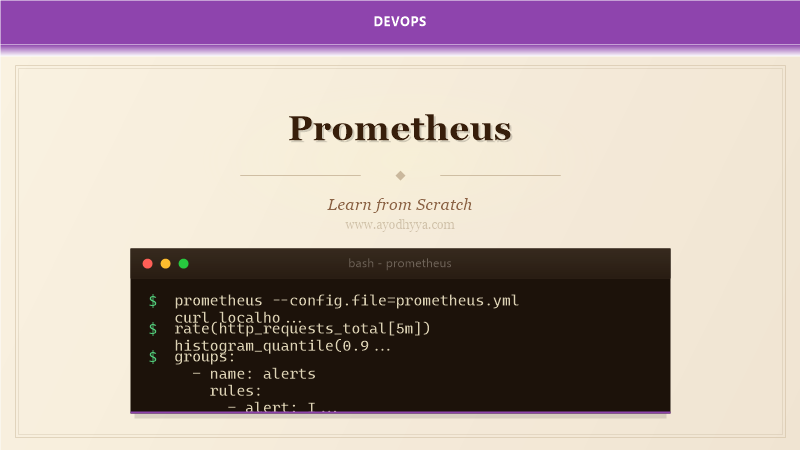
When I joined my first SRE team, the monitoring system was a pile of Nagios scripts and emails nobody read. Prometheus changed our entire approach to observability. It scrapes metrics from targets at regular intervals, stores them in a time-series database, and powers a flexible query language — PromQL — that lets you slice and aggregate data in real time. Its pull-based model, multi-dimensional data model, and powerful alerting made it the de-facto standard for cloud-native monitoring.
By the end of this tutorial, you will understand the Prometheus metrics model, how to instrument applications with client libraries, how to write PromQL queries for common monitoring scenarios, and how to set up alerting rules that page the right person at the right time.
Prometheus Architecture and Installation
Prometheus's pull model means the server scrapes targets at specified intervals. Each target exposes metrics via an HTTP endpoint, typically /metrics. The server stores data locally in a custom TSDB format on disk. The architecture includes the main Prometheus server, Alertmanager for deduplication and routing of alerts, and exporters that translate metrics from third-party systems into the Prometheus format. I install Prometheus using the official binaries, Docker image, or the kube-prometheus-stack Helm chart for Kubernetes deployments. Configuration is in prometheus.yml: global settings define scrape interval and evaluation interval, scrape_configs define target groups.
global:
  scrape_interval: 15s
  evaluation_interval: 15s
alerting:
  alertmanagers:
    - static_configs:
        - targets: ['localhost:9093']
scrape_configs:
  - job_name: 'prometheus'
    static_configs:
      - targets: ['localhost:9090']
The Prometheus Metrics Model and Data Types
Prometheus stores metrics as time-series data identified by a metric name and a set of key-value labels. The four core metric types are: Counter (cumulative count that only increases), Gauge (single numeric value that can go up and down), Histogram (samples observations in configurable buckets), and Summary (similar to histogram but calculates quantiles on the client side). Labels make metrics multi-dimensional — instead of separate metrics for each HTTP status code, you have a single metric http_requests_total with a status label.
# HELP http_requests_total Total number of HTTP requests
# TYPE http_requests_total counter
http_requests_total{method="GET", endpoint="/api/users", status="200"} 1027
http_requests_total{method="POST", endpoint="/api/users", status="500"} 13
PromQL: Querying Metrics Effectively
PromQL is the Prometheus query language. Selectors fetch time series by metric name and label matchers. Range vectors add a time duration like [5m] to query historical data. Aggregation operators like sum, avg, min, max, and count work across dimensions. The by and without clauses control which labels are preserved. Functions like rate() calculate per-second average rate of a counter over a time window, histogram_quantile() calculates percentiles from histogram buckets.
rate(http_requests_total[5m])
histogram_quantile(0.95, sum(rate(http_request_duration_seconds_bucket[5m])) by (le))
topk(3, avg(node_cpu_seconds_total[5m]) by (instance))
Exporters and Service Discovery
Not every system exposes Prometheus metrics natively. Exporters bridge the gap. The node_exporter exposes Linux kernel and hardware metrics. The blackbox_exporter probes HTTP, HTTPS, DNS, TCP, and ICMP endpoints. Service discovery in prometheus.yml tells Prometheus which targets to scrape. Supported mechanisms include Kubernetes service discovery, EC2, Consul, DNS SRV records, and file-based discovery. I configure relabeling rules to enrich metrics with additional labels like environment, team, and region.
scrape_configs:
  - job_name: 'kubernetes-pods'
    kubernetes_sd_configs:
      - role: pod
    relabel_configs:
      - source_labels: [__meta_kubernetes_pod_annotation_prometheus_io_scrape]
        action: keep
        regex: true
Alerting Rules and Alertmanager
Alerting rules in Prometheus evaluate PromQL expressions and fire alerts when conditions persist for a specified duration. Each rule has a name, expression, duration, labels, and annotations. Annotations provide context: summary, description, runbook URL, severity. Alertmanager handles alert deduplication, grouping, inhibition, and routing. I configure routes to send critical infrastructure alerts to PagerDuty, warning-level alerts to Slack. Inhibition rules suppress lower-severity alerts when a critical alert is firing.
groups:
  - name: node_alerts
    rules:
      - alert: NodeDown
        expr: up{job="node"} == 0
        for: 5m
        annotations:
          summary: "Node {{ $labels.instance }} is down"
          severity: critical
Recording Rules and SRE Best Practices
Recording rules precompute frequently used or computationally expensive expressions and store them as new time series. This speeds up dashboard queries and reduces PromQL evaluation load. I create recording rules for SRE golden signals: request rate, error rate, latency percentiles, and saturation. Alert fatigue is the enemy of reliable on-call — I design alerts with clear severity levels and ensure every alert has a runbook.
groups:
  - name: recording_rules
    rules:
      - record: job:http_requests:rate5m
        expr: sum(rate(http_requests_total[5m])) by (job)
      - record: job:http_request_duration_seconds:p99
        expr: histogram_quantile(0.99, sum(rate(http_request_duration_seconds_bucket[5m])) by (job, le))
Frequently Asked Questions
How long does Prometheus store data?
By default, Prometheus stores data for 15 days locally based on the --storage.tsdb.retention.time flag. For long-term storage, use remote write to send data to systems like Thanos, Cortex, Mimir, or VictoriaMetrics.
What is the difference between Prometheus and Grafana?
Prometheus is a time-series database and monitoring system with its own query language (PromQL) and alerting engine. Grafana is a visualization layer that can use Prometheus as a data source to build dashboards.
How do I monitor Prometheus itself?
Prometheus exposes its own metrics at /metrics under the prometheus_* namespace. Key metrics include prometheus_tsdb_head_series for cardinality and prometheus_tsdb_blocks_loaded for storage.
Can Prometheus handle high-cardinality metrics?
Prometheus performance degrades with high cardinality — too many unique label combinations. Keep label values bounded. Avoid putting user IDs or email addresses in labels.
Originally published on Ayodhyyya. Last updated June 1, 2026.