JMeter Tutorial: Learn Performance Testing from Scratch (2026)
I once spent three days trying to figure out why an e-commerce site crashed every Black Friday. The answer came from a JMeter report that revealed a connection pool leak under 500 concurrent users. That experience taught me that performance testing is not optional — it is how you sleep well at night during high-traffic events.
JMeter is the most widely used open-source performance testing tool. It simulates multiple users sending requests to a server and collects metrics like response time, throughput, and error rate. In this tutorial, you will learn how to design realistic load tests, analyze results, and integrate performance testing into your development workflow.
Installing JMeter and Understanding the GUI
JMeter runs on Java, so the first step is ensuring you have JDK 8 or later installed. Download the binary from the Apache JMeter website, extract it, and run jmeter.bat on Windows or jmeter on Linux. The GUI opens with a tree structure on the left and configuration panels on the right.
The Test Plan is the root element. Under it, you add Thread Groups (virtual users), Samplers (HTTP requests, JDBC queries), Listeners (reporters), and Assertions (validations). Spend time learning the tree metaphor — every element in JMeter nests inside another, and the scoping rules determine which elements apply to which samplers.
java -version
# Ensure Java 8+
# Download from https://jmeter.apache.org/
unzip apache-jmeter-*.zip
cd apache-jmeter-*/bin && ./jmeter
Creating Your First Thread Group and Sampler
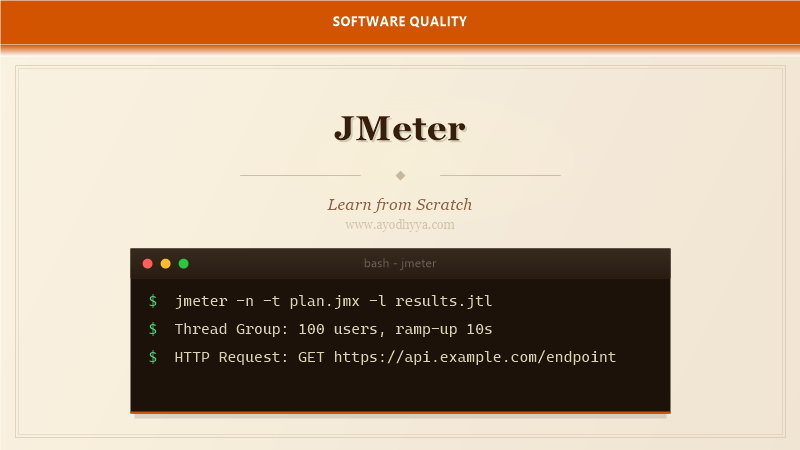
A Thread Group represents a pool of virtual users. You configure the number of threads, ramp-up period, and loop count. For example, 100 threads with a 10-second ramp-up means JMeter starts 10 new users per second until reaching 100.
Inside the Thread Group, add an HTTP Request Sampler. Fill in the protocol, server name, port, and path. Add a View Results Tree Listener to see the raw request and response. Run the test and inspect the output. This is your first load test — congratulations.
Thread Group: 50 users, ramp-up 5s, loop 1
  HTTP Request: GET https://api.example.com/health
    View Results Tree
Parameterizing Tests with CSV Data and Variables
Realistic load tests use varied data — different usernames, search terms, or product IDs. JMeter provides the CSV Data Set Config element to read data from a file. Each thread picks the next row, and you reference columns using variable names like ${username}.
User-Defined Variables let you set constants at the test plan level. Combined with functions like __Random and __time, you can generate dynamic data without external files. This is crucial for simulating realistic user behavior rather than sending the same request repeatedly.
CSV Data Set Config:
  Filename: users.csv
  Variable Names: username,password
  Delimiter: ,
  Recycle on EOF: True
Adding Assertions and Timers
Assertions validate that responses meet expectations. The Response Assertion checks that the response contains or does not contain a specific string. The Duration Assertion fails if a response takes longer than a threshold. Without assertions, a test passes even if every request returns a 500 error.
Timers simulate real user think time between actions. The Constant Timer adds a fixed delay; the Gaussian Random Timer creates more natural variation. Adding realistic timers prevents your test from overwhelming the server with back-to-back requests that no real user would generate.
Response Assertion:
  Field to Test: Text Response
  Pattern: "login successful"
  Duration Assertion: 3000 ms
Analyzing Results with Listeners and Reports
JMeter includes several Listeners to visualize results. The Summary Report shows aggregate metrics like average, min, max, and error percentage. The Aggregate Report adds throughput and percentiles. For real-time monitoring, the Backend Listener can send metrics to InfluxDB and visualize with Grafana.
For professional reporting, use the Generate HTML Report command after a non-GUI test run. It produces an interactive dashboard with charts for response times, active threads, and transactions per second. This is what you will share with stakeholders to demonstrate performance characteristics.
jmeter -n -t test-plan.jmx -l results.jtl -e -o report/
# -n non-GUI, -t test plan, -l results, -e generate, -o output
Advanced Techniques: Distributed Testing and Plugins
When a single machine cannot generate enough load, JMeter supports distributed testing. One controller machine coordinates multiple worker machines. Each worker runs jmeter-server and executes the test against the target. This lets you simulate thousands of concurrent users from different IP addresses.
The JMeter Plugins Manager extends functionality with custom samplers, listeners, and thread groups like the Ultimate Thread Group, which provides finer control over load patterns. The Throughput Shaping Timer lets you design precise load profiles that mirror production traffic patterns.
# On each worker:
jmeter-server -Djava.rmi.server.hostname=
# On controller:
jmeter -n -t plan.jmx -R worker1-ip,worker2-ip
Frequently Asked Questions
What is the difference between JMeter and LoadRunner?
JMeter is open-source and runs on any platform with Java. LoadRunner is a commercial tool with more protocol support and enterprise features. JMeter is sufficient for most HTTP, JDBC, and SOAP performance tests.
Can JMeter test REST APIs and GraphQL?
Yes. For REST, use the HTTP Request sampler with GET, POST, PUT, DELETE methods. For GraphQL, send a POST request with the query in the request body and set Content-Type to application/json.
How do I handle authentication in JMeter?
Use the HTTP Authorization Manager for basic auth. For token-based auth, extract the token from the login response using a JSON Extractor or Regular Expression Extractor and pass it as a header in subsequent requests.
Why are my JMeter results showing high response times?
High response times can be caused by insufficient load generator resources, network latency, server bottlenecks, or JMeter itself running out of heap memory. Monitor CPU and memory on both the load generator and the target server.
Originally published on Ayodhyyya. Last updated June 1, 2026.